Compare two Excel sheets for Matches and Differences with Excel VBA Workbook
ompare two datasets or sheets, find out newly Added rows, Deleted rows, and CELL level Variances with just a few clicks
ExActProBi
Summary
- Reed courses certificate of completion - Free
- Tutor is available to students
Add to basket or enquire
Overview
This course will teach you how to compare two similarly structured (exact same number of columns) data and find the addition of data from old to new, deletion of data from old to new and variances between existing data rows which are available in both data sets.
And you can do this with an already crafted Excel VBA workbook. The workbook has already set structured where you can just compare two data sets (Sheets) and find out differences and similarities at cell level
This is very important for data analysis, especially datasets like HR and Payroll, Stocks and Inventories, Sales commission and sales for each person! and there is much other application of this workbook.
Curriculum
-
Introduction to Compare Data Workbook 21:34
-
Comprehensive Introduction to Compare Data Excel VBA Workbook 35:56
-
Modify VBA Codes to suit your needs 18:06
-
Data Cleaning, Format and Structure your datasets with Power Query 14:29
-
Practical and Real world application of Compare data Workbook 43:59
-
Conclusion, Thank you and Some Important Facts about Compare Data Workbook 05:00
Course media
Description
Have you ever had a need to Compare two datasets or worksheets?
As an entrepreneur, accountant, HR personnel, stockbroker, etc. comparing two datasets becomes a regular task in your career.
Whether it is to compare employee datasets, salary or payroll, stocks, sales commission and so much more; you will definitely find yourself coming across tabular worksheets from time to time.
It can get pretty tasking and most discouraging is the fact that traditional methods which you often used in Microsoft Excel such as functions, formula and power query; are not always reliable or can provide you answers.
If you are in the category mentioned above, worry no more. The perfect solution is here — Smart VBA Excel Workbook. With it, you can now find new data, deleted data, variances.
What if I say you could find out CELL level Variances with just a few clicks using the Compare data workbook? Sounds amazing?
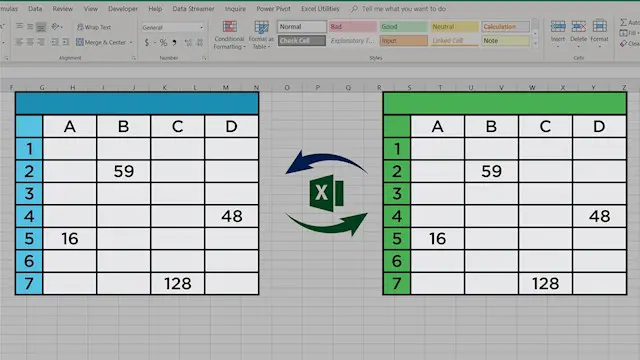
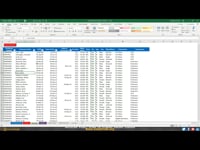
That is what Compare Data Excel VBA workbook is designed to do; it compares two similarly structured datasets or worksheets by Row and then by Each CELL.
-
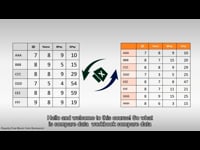
You will typically have datasets or worksheets in periodic format, i.e. Last months dataset and Current Months dataset, and you would like to find out variances first at Row level and then at CELL level.
-
Compare data workbook finds out added data in a current month, removed data in a current month (from last month) and for datasets/rows/records which are existing in both places (Last month and current month), it highlights variances at each cell level.
This is something awesome, and it is difficult to achieve this with traditional Excel formulas and functions or even with Modern excel tools as Power Query Joins. The only way out is smart VBA coding in Excel.
In this course, I will walk you through how to use this fantastic compare data workbook and teach you:
-
How to set up the workbook for best results.
-
How to change important VBA Code settings to suit your need.
-
How to change the formatting of added data, removed data and variance data.
-
How to set up this workbook in an ideal way so that you can create truly dynamic and reusable reports for any complex data analysis.
In the end, we will go through two practical examples:
-
We will analyse the Mutual fund portfolio to find out critical variances between the two dates (position).
-
We will go through a comprehensive Payroll analysis exercise where I will create a fantastic Payroll variance dashboard to find out variances for various pay types (Basic, HRA, Overtime, deduction etc.) in complex payroll data.
-
With these examples, you will also learn how to set up this workbook to maximise your productivity.
Enrol Now and Let your data analysis and data comparison problems go away!
Who is this course for?
- Accountants, Auditors, Analysts who want to accurately compare data with few clicks
- Data Analysts, Data Science Professionals who want to find out data variances quickly
- Busy HR Professional, Sales Professional, Small Business Owners, Entrepreneurs
Requirements
-
Basic Knowledge of Microsoft Excel
-
Basic to Intermediate knowledge of Excel Formulas and Functions
-
Basic to Intermediate Knowledge of Excel VBA
Career path
If you are new to data analysis and data science career path, this course will give you the basics of data analysis and what tools are best for your data. But since Excel is a well known and very popular application, it would be best to start your journey from this course!
Questions and answers
Currently there are no Q&As for this course. Be the first to ask a question.
Certificates
Reed courses certificate of completion
Digital certificate - Included
Will be downloadable when all lectures have been completed
Reviews
Currently there are no reviews for this course. Be the first to leave a review.

Add to basket or enquire
Course provided by
Legal information
This course is advertised on reed.co.uk by the Course Provider, whose terms and conditions apply. Purchases are made directly from the Course Provider, and as such, content and materials are supplied by the Course Provider directly. Reed is acting as agent and not reseller in relation to this course. Reed's only responsibility is to facilitate your payment for the course. It is your responsibility to review and agree to the Course Provider's terms and conditions and satisfy yourself as to the suitability of the course you intend to purchase. Reed will not have any responsibility for the content of the course and/or associated materials.
